EODIE Galaxy -tool tutorials
The GUI version of EODIE can be found on the Galaxy Europe website (https://usegalaxy.eu/root?tool_id=toolshed.g2.bx.psu.edu/repos/climate/eodie/eodie/1.0.2).
The Galaxy tool uses EODIE version 1.0.2. Available satellite image platforms include Sentinel-2 and Landsat-8. Several indices and statistics can be calculated in one job and multiple jobs can be run simultaneously in Galaxy. However, it is recommended to use EODIE via the command line for processing a large number of images.
Sentinel-2 Tutorial
In this tutorial we will run EODIE with one Sentinel-2 image and calculate the mean NDVI of the test polygons. The Sentinel-2 tiling grid can be downloaded here in .kml format: https://sentinels.copernicus.eu/web/sentinel/missions/sentinel-2/data-products. Note that the file must be converted to .shp format before running EODIE.
Sentinel-2 data in .tar or .zip format
Sentinel 2 tiling in .shp format
Vector polygons in .shp format
Index statistics per polygon in .csv format
Index statistics in GeoTiff format
Workflow:
1. Choose “Upload data” on the left and upload required inputs (Fig. 1). Notice that a parent folder must be included in the .tar or .zip file. For shapefiles, use upload option “Composite” and upload the shapefile and all related auxiliary files (.shx, .dbf and .prj in this example). Use option “Regular” for satellite data.
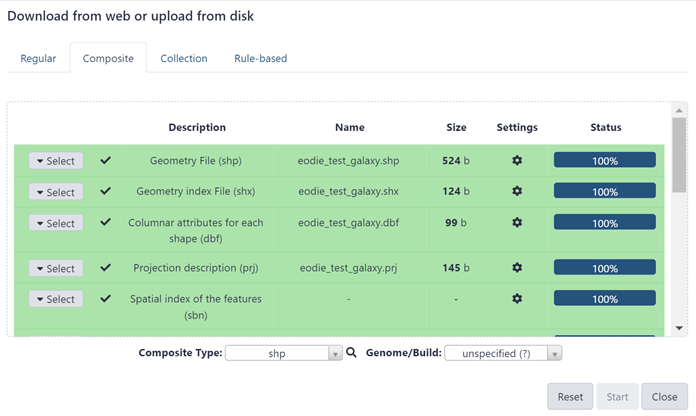
Figure 1. Uploading data to Galaxy.
2. Search for “EODIE” in the “Tools” search box and select the EODIE-tool. Specify platform, Sentinel-2 in this example, and input files under corresponding headers in the tool window (Fig. 2). “Name of Identifier” parameter refers to the name of the shapefile column that contains polygon ids.
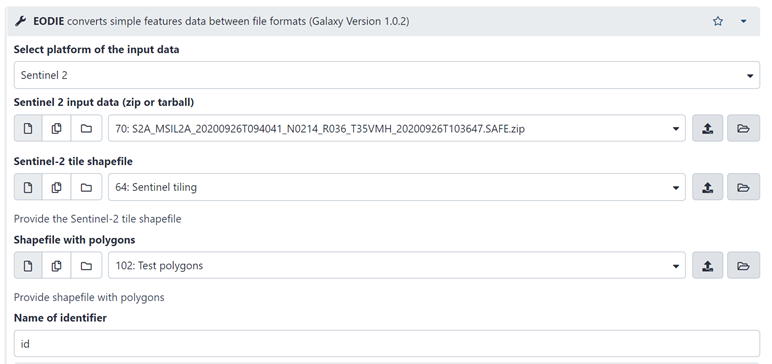
Figure 2. Define inputs in the tool window.
3. Time frame, statistics and indices can be defined under the ‘Advanced options’ -section (Fig. 3). Choose one or more indices and statistics: here we selected ndvi and mean. Available output options include csv and geotiff. When all inputs are defined, click “Execute” at the bottom of the tool window.
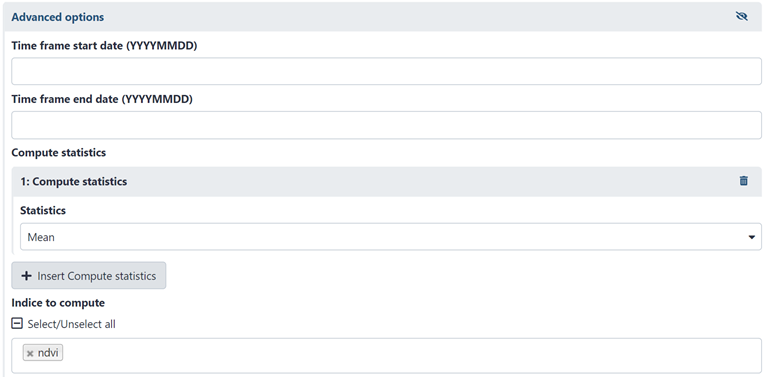
Figure 3. Advanced options.
4. The progress of the job can be followed in the History-panel (Fig. 4). Grey color means that the job is in queue, orange indicates that it is running, and green color means it has succeeded. Red color indicates that the job has failed.
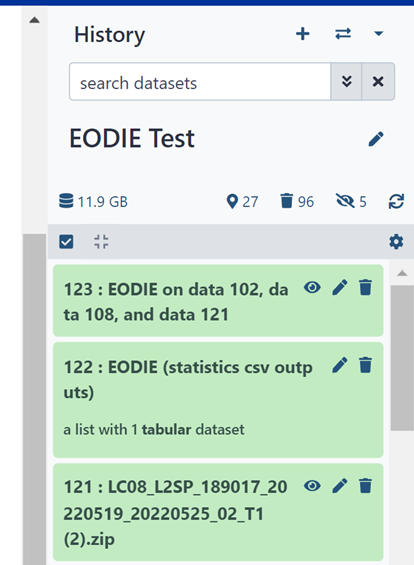
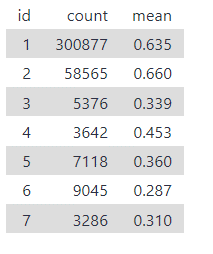
Figure 4. Follow the progress of the job in the History-panel. Below is the resulted NDVI csv.
We can see that the example job was successful, and a csv file was created. Mean is the average NDVI of polygon features and count is the number of valid pixels per polygon.
Landsat-8 Tutorial
Eodie can be run with Landsat 8 images, as well. Tool settings for Landsat images are otherwise the same as for Sentinel images, except that “platform of the input data” is set to “Landsat 8”.
Landsat image in .tar or .zip format
Shapefile with polygons
Landsat 8 tile shapefile.
The Landsat tile shapefiles can be downloaded here: https://www.usgs.gov/landsat-missions/landsat-shapefiles-and-kml-files (“Landsat WRS 2 Descending Path Row Shapefile” is used in this example.)
Index statistics per polygon in .csv format
Index statistics in GeoTiff format
The workflow follows Sentinel-instructions (see Figures 1-4 above):
Upload input files to Galaxy.
2. Select EODIE-tool and define inputs (Fig. 5). Remember to select “Landsat-8” as platform type and specify the name of the id column.
Choose time frame, indices and statistics under “Advanced options” and click “Execute”.
4. Follow the progress of the job in the History-panel. Different colors indicate the status of the job: Grey = job is in queue, Red = job has failed, orange = job is running, green = job has succeeded.
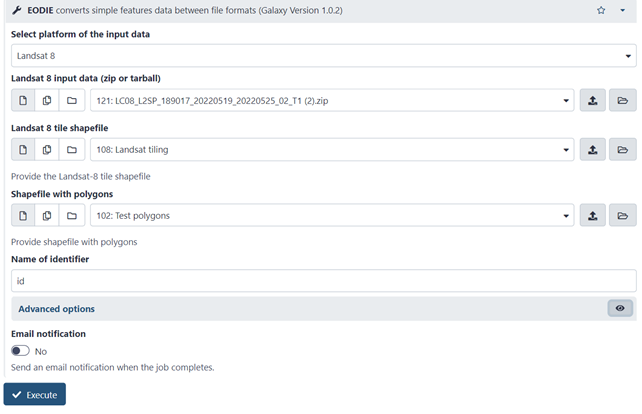
Figure 5. Landsat example.